
VT Volume Profile
A rolling multi-day volume profile that finds Point of Control, Value Area, and Low Volume Nodes, re-ranked as you widen or narrow the lookback.
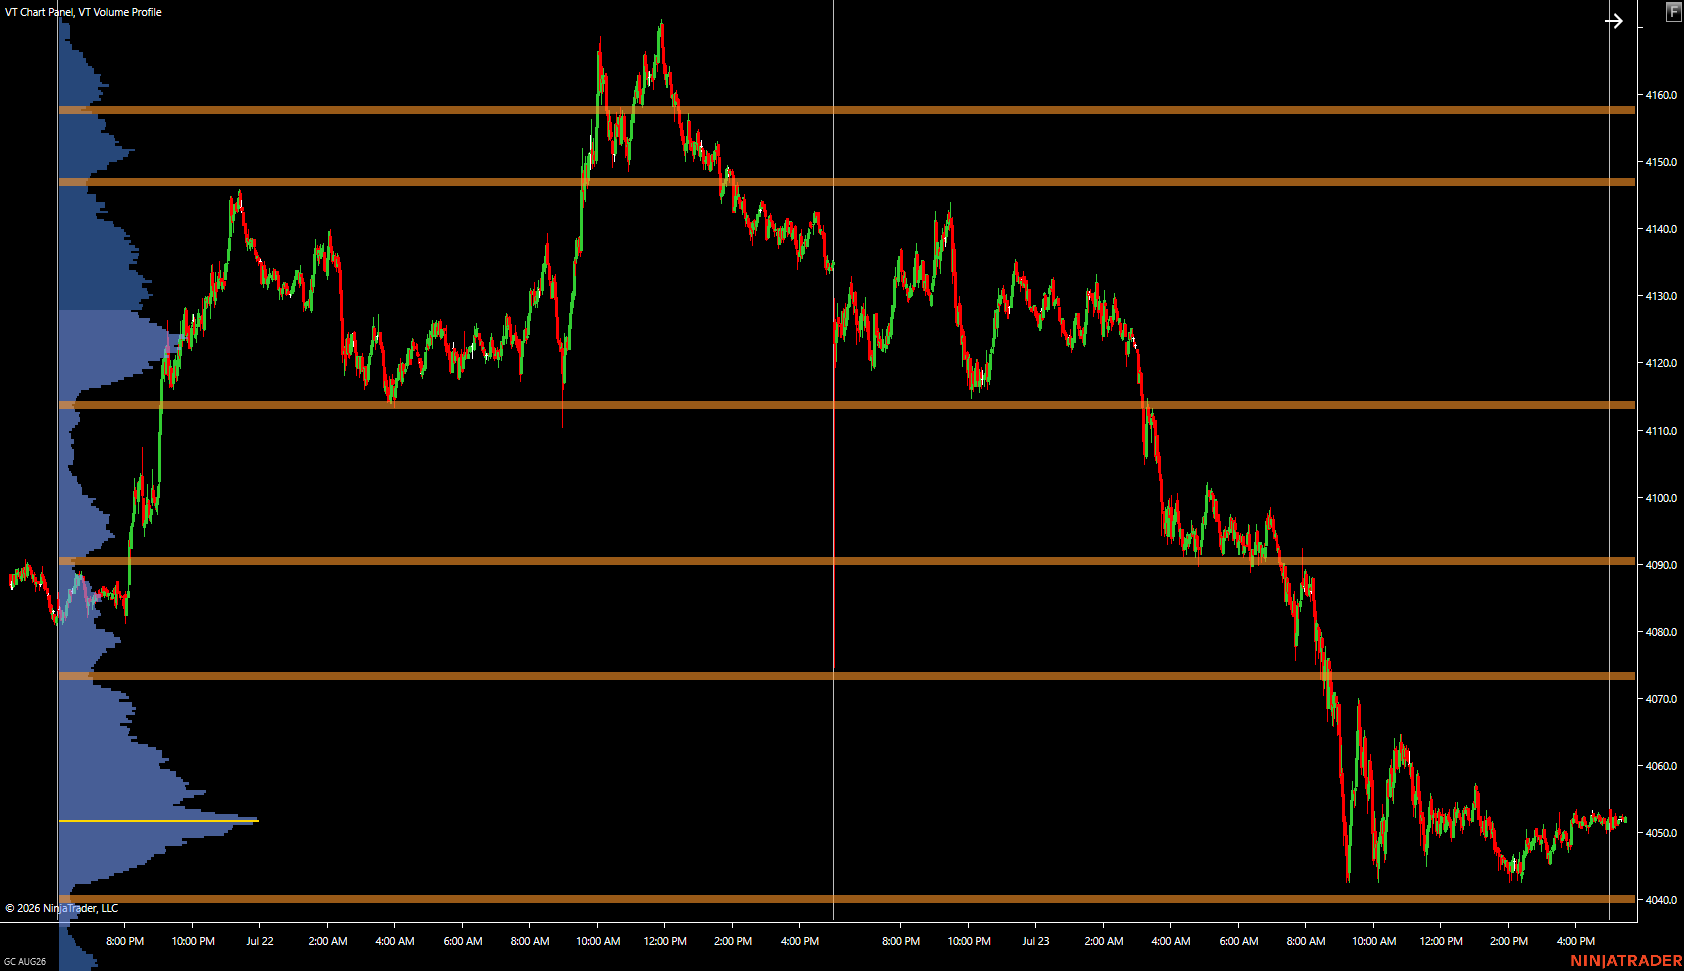
Composite Profile with Low Volume Nodes
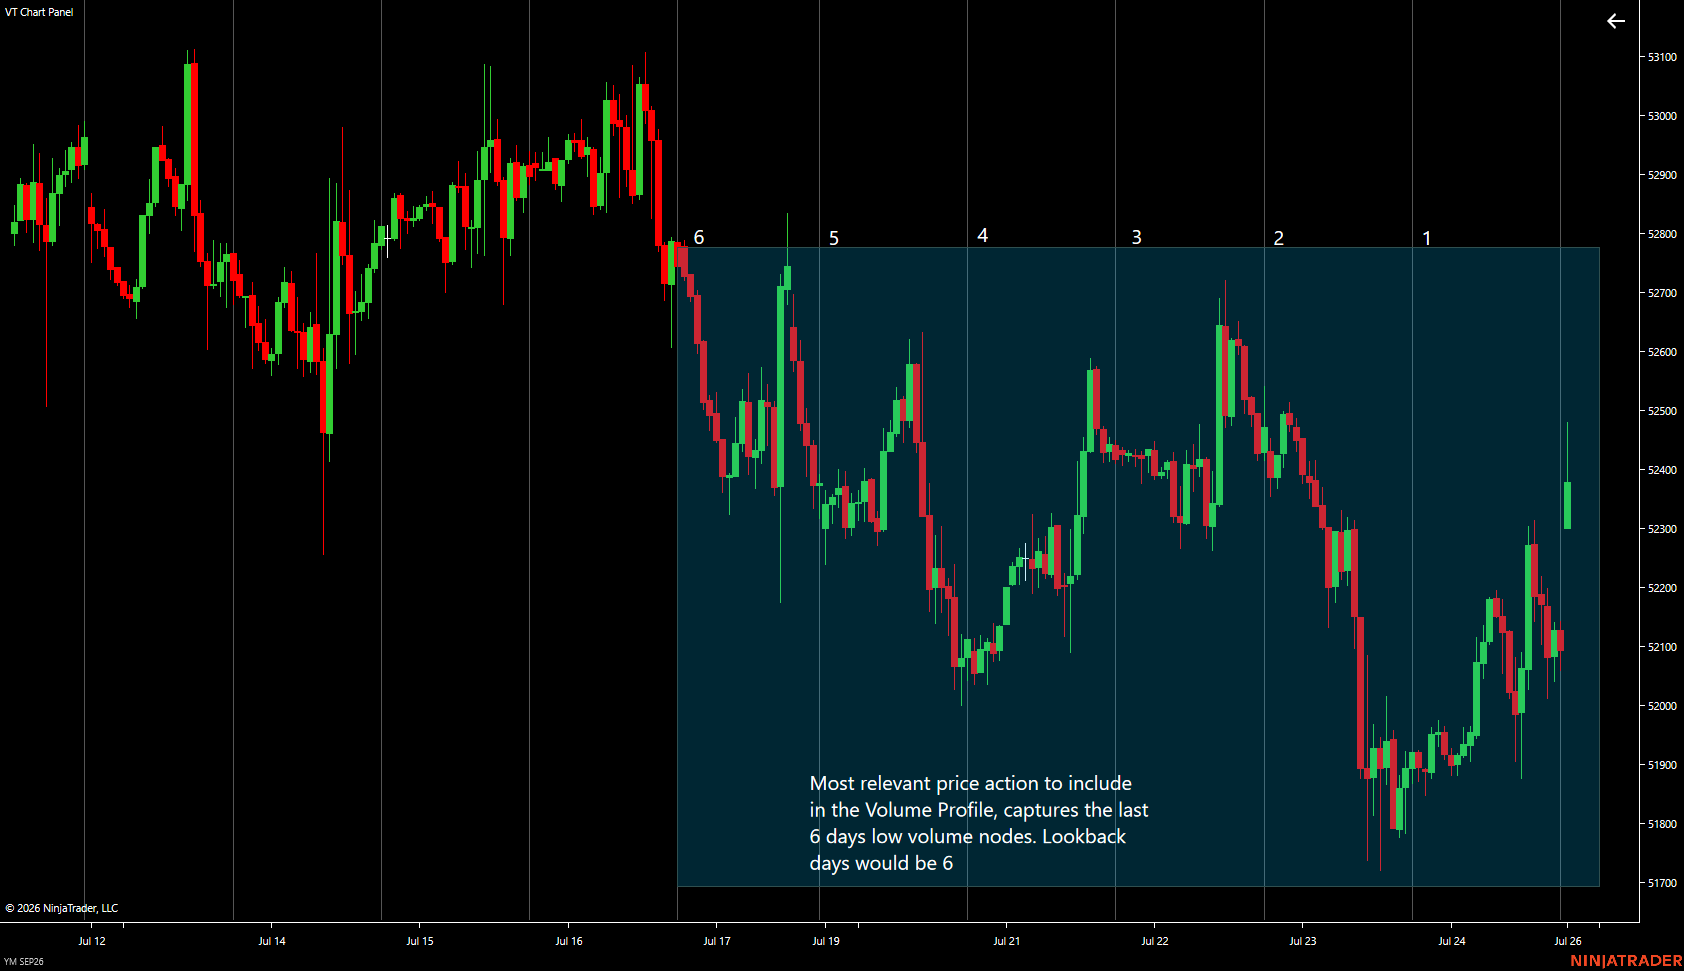
Lookback Days
How to Use
A Volume Profile is a horizontal histogram plotted on your chart showing how much volume traded at each price level over a selected period. Unlike traditional volume bars which show when volume occurred, Volume Profile shows where it occurred — at what price. That distinction changes everything. Where volume is high, the market found agreement. Buyers and sellers transacted heavily at those prices, which means participants have positions built there and will defend them. Where volume is thin, the market moved quickly — one side overwhelmed the other and price left the area fast, with little transacted business to anchor it. This is the foundation of the most powerful support and resistance analysis available to futures traders — not lines drawn on a chart based on historical highs and lows, but levels defined by where the market actually did business.